With the onset of COVID-19 in March 2020 – and the ensuing economic shutdowns – The Colorado State Epidemiologists Office, CDOT, and Navjoy worked collaboratively to develop a weekly report that would give decision makers an overview of the impacts to the state.
Project History
This report was developed to quantify the impact of COVID-19 and the Stay At Home ordinance on traffic volumes along key Colorado highways and interstates. This 2X weekly report helped traffic engineers and government officials closely monitor the impacts of ordinances (e.g., Stay at Home, partial re-opening) on travelers.
Navjoy, CDOT, DMO, and the State Epidemiologist Office worked collaboratively to select 15 locations that were representative of statewide traffic patterns. Navjoy and CDOT DMO experimented with various performance measures and ways to visually represent the traffic changes before settling on a final daily traffic report.
Navjoy uses CDOT's COGNOS reporting tool to access traffic counts collected by ATRs. The data is then manipulated further to summarize and visually communicate the information to be shared with a more general audience.
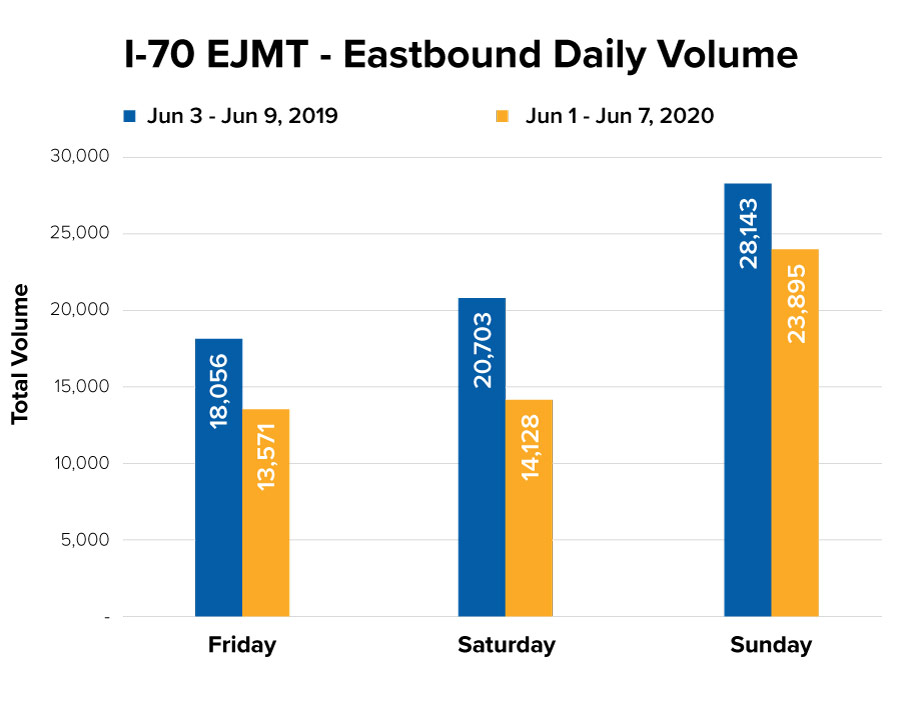
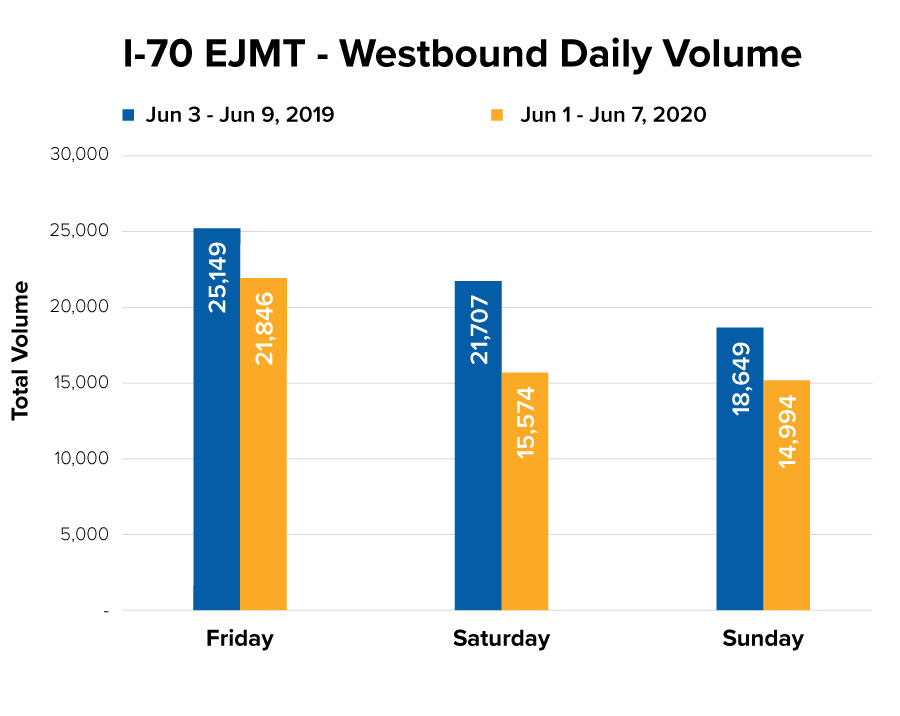
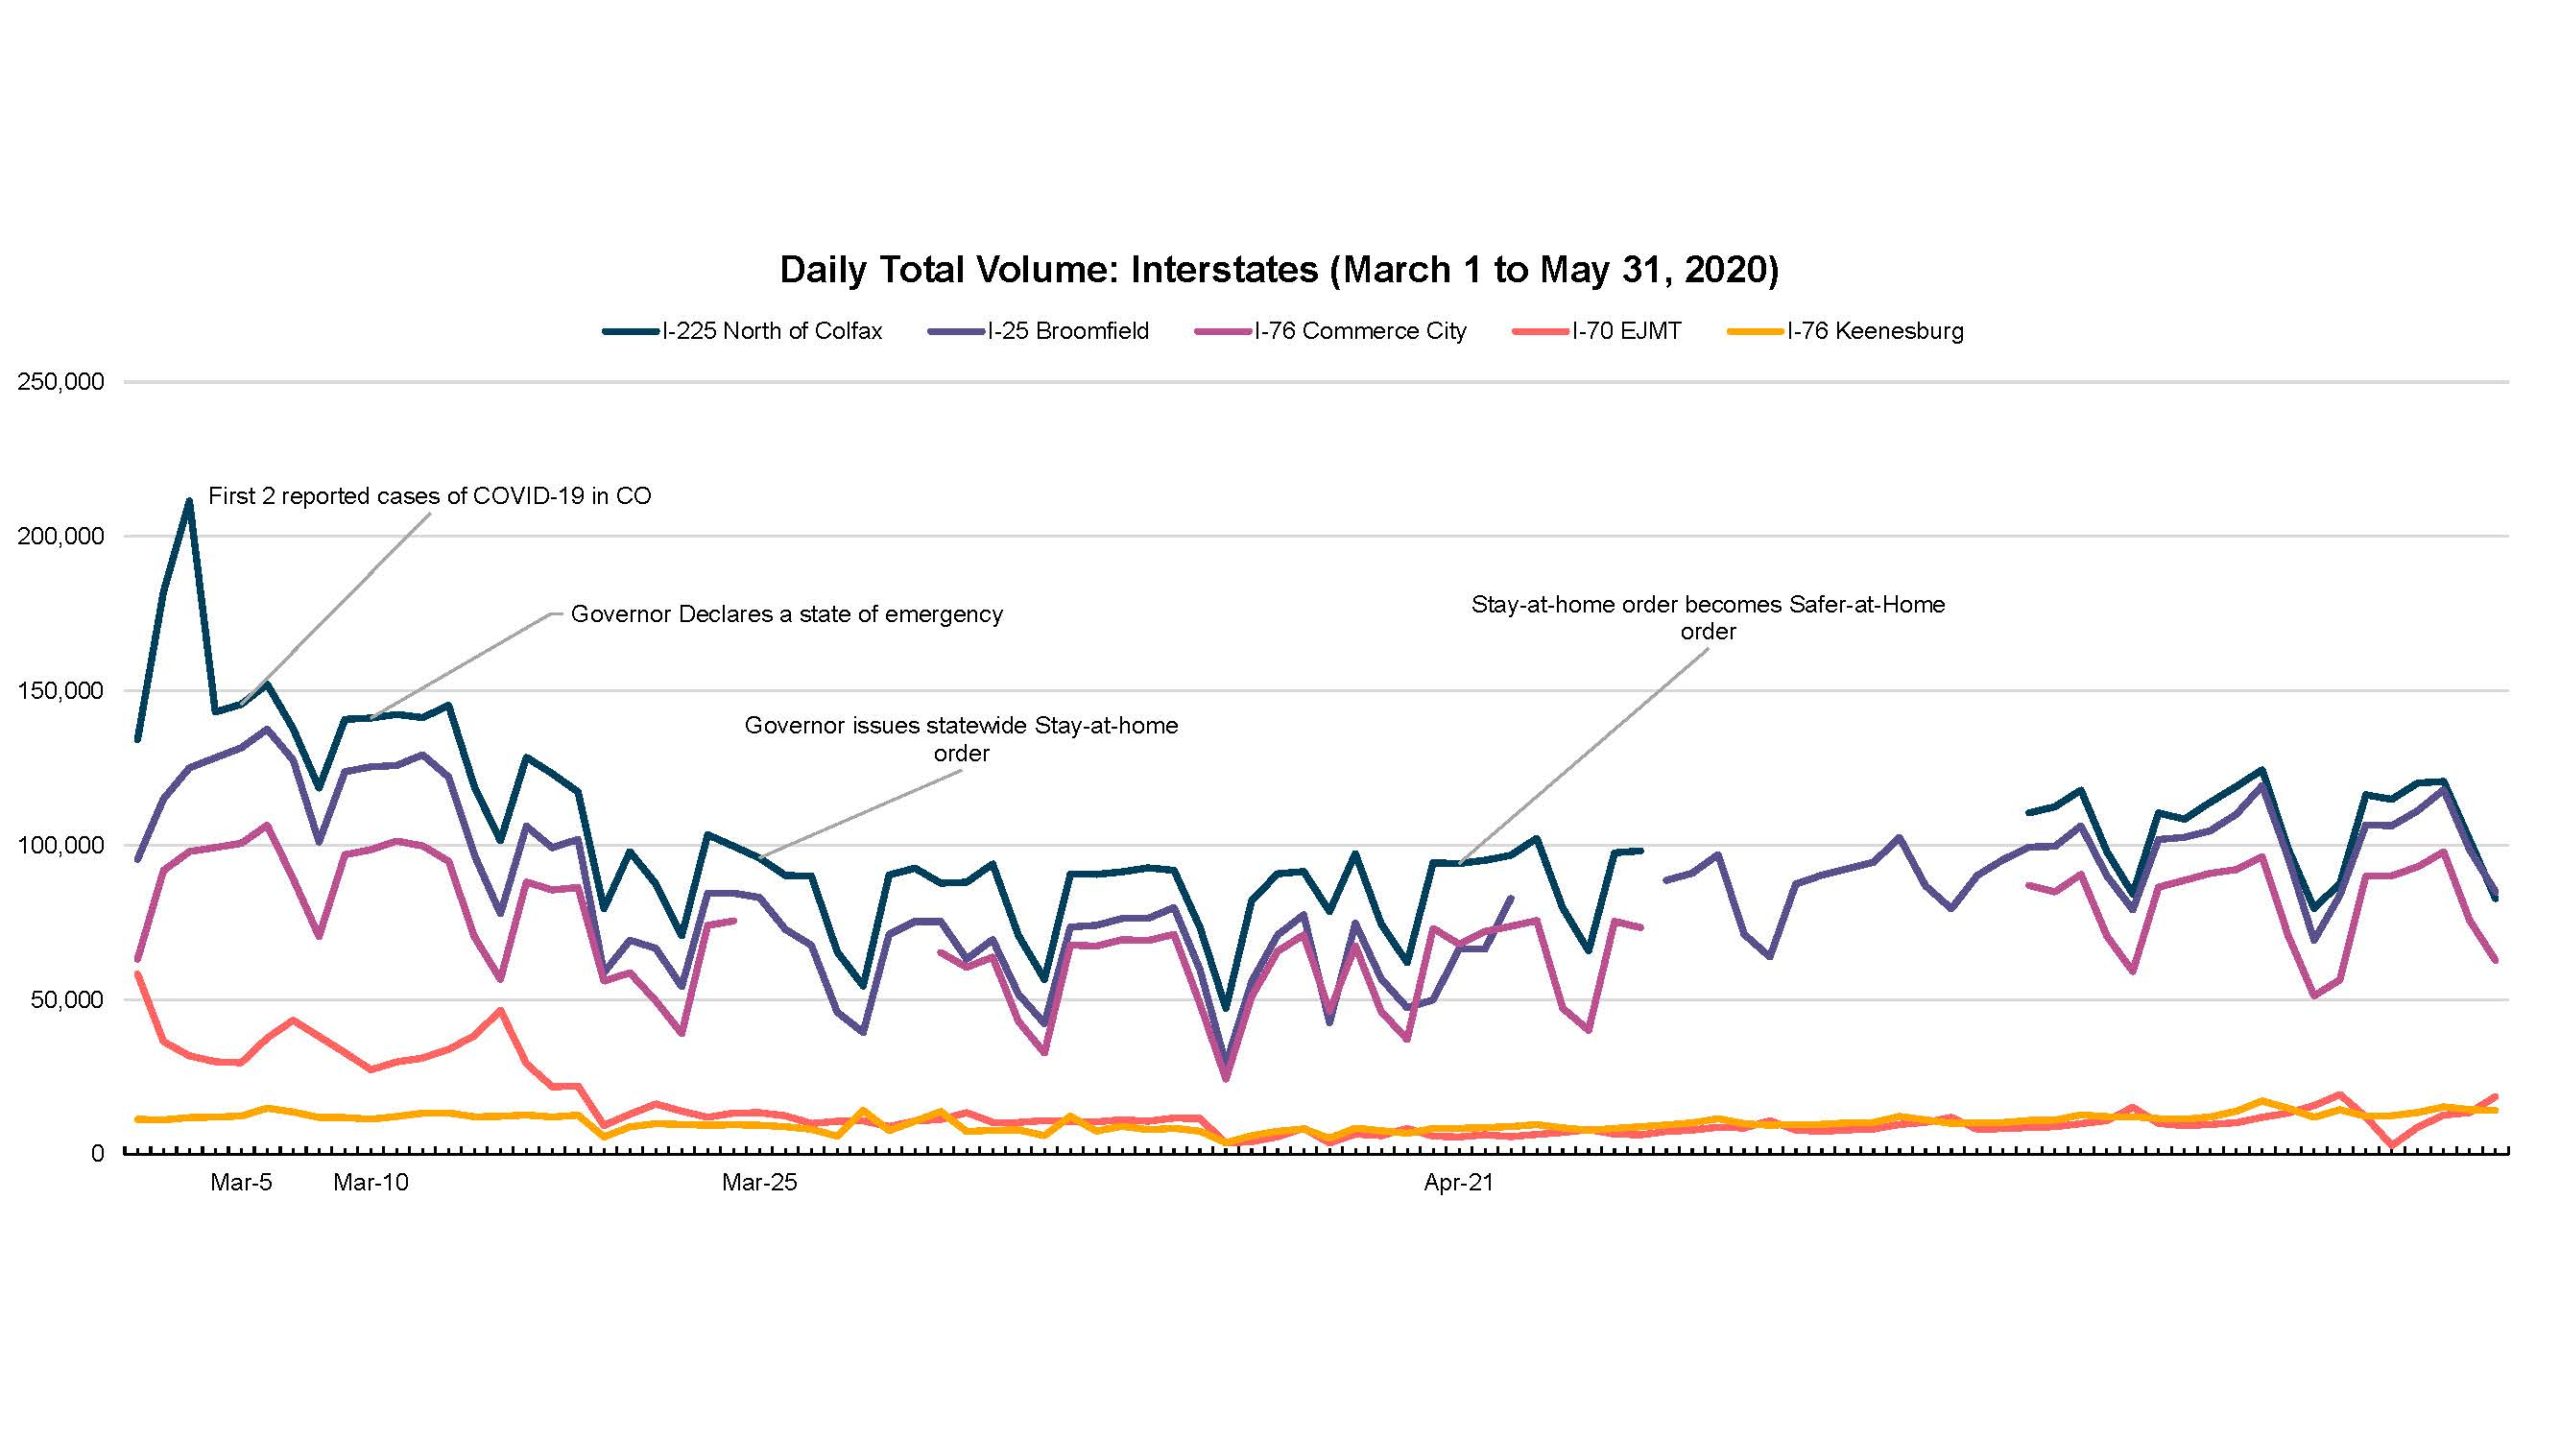
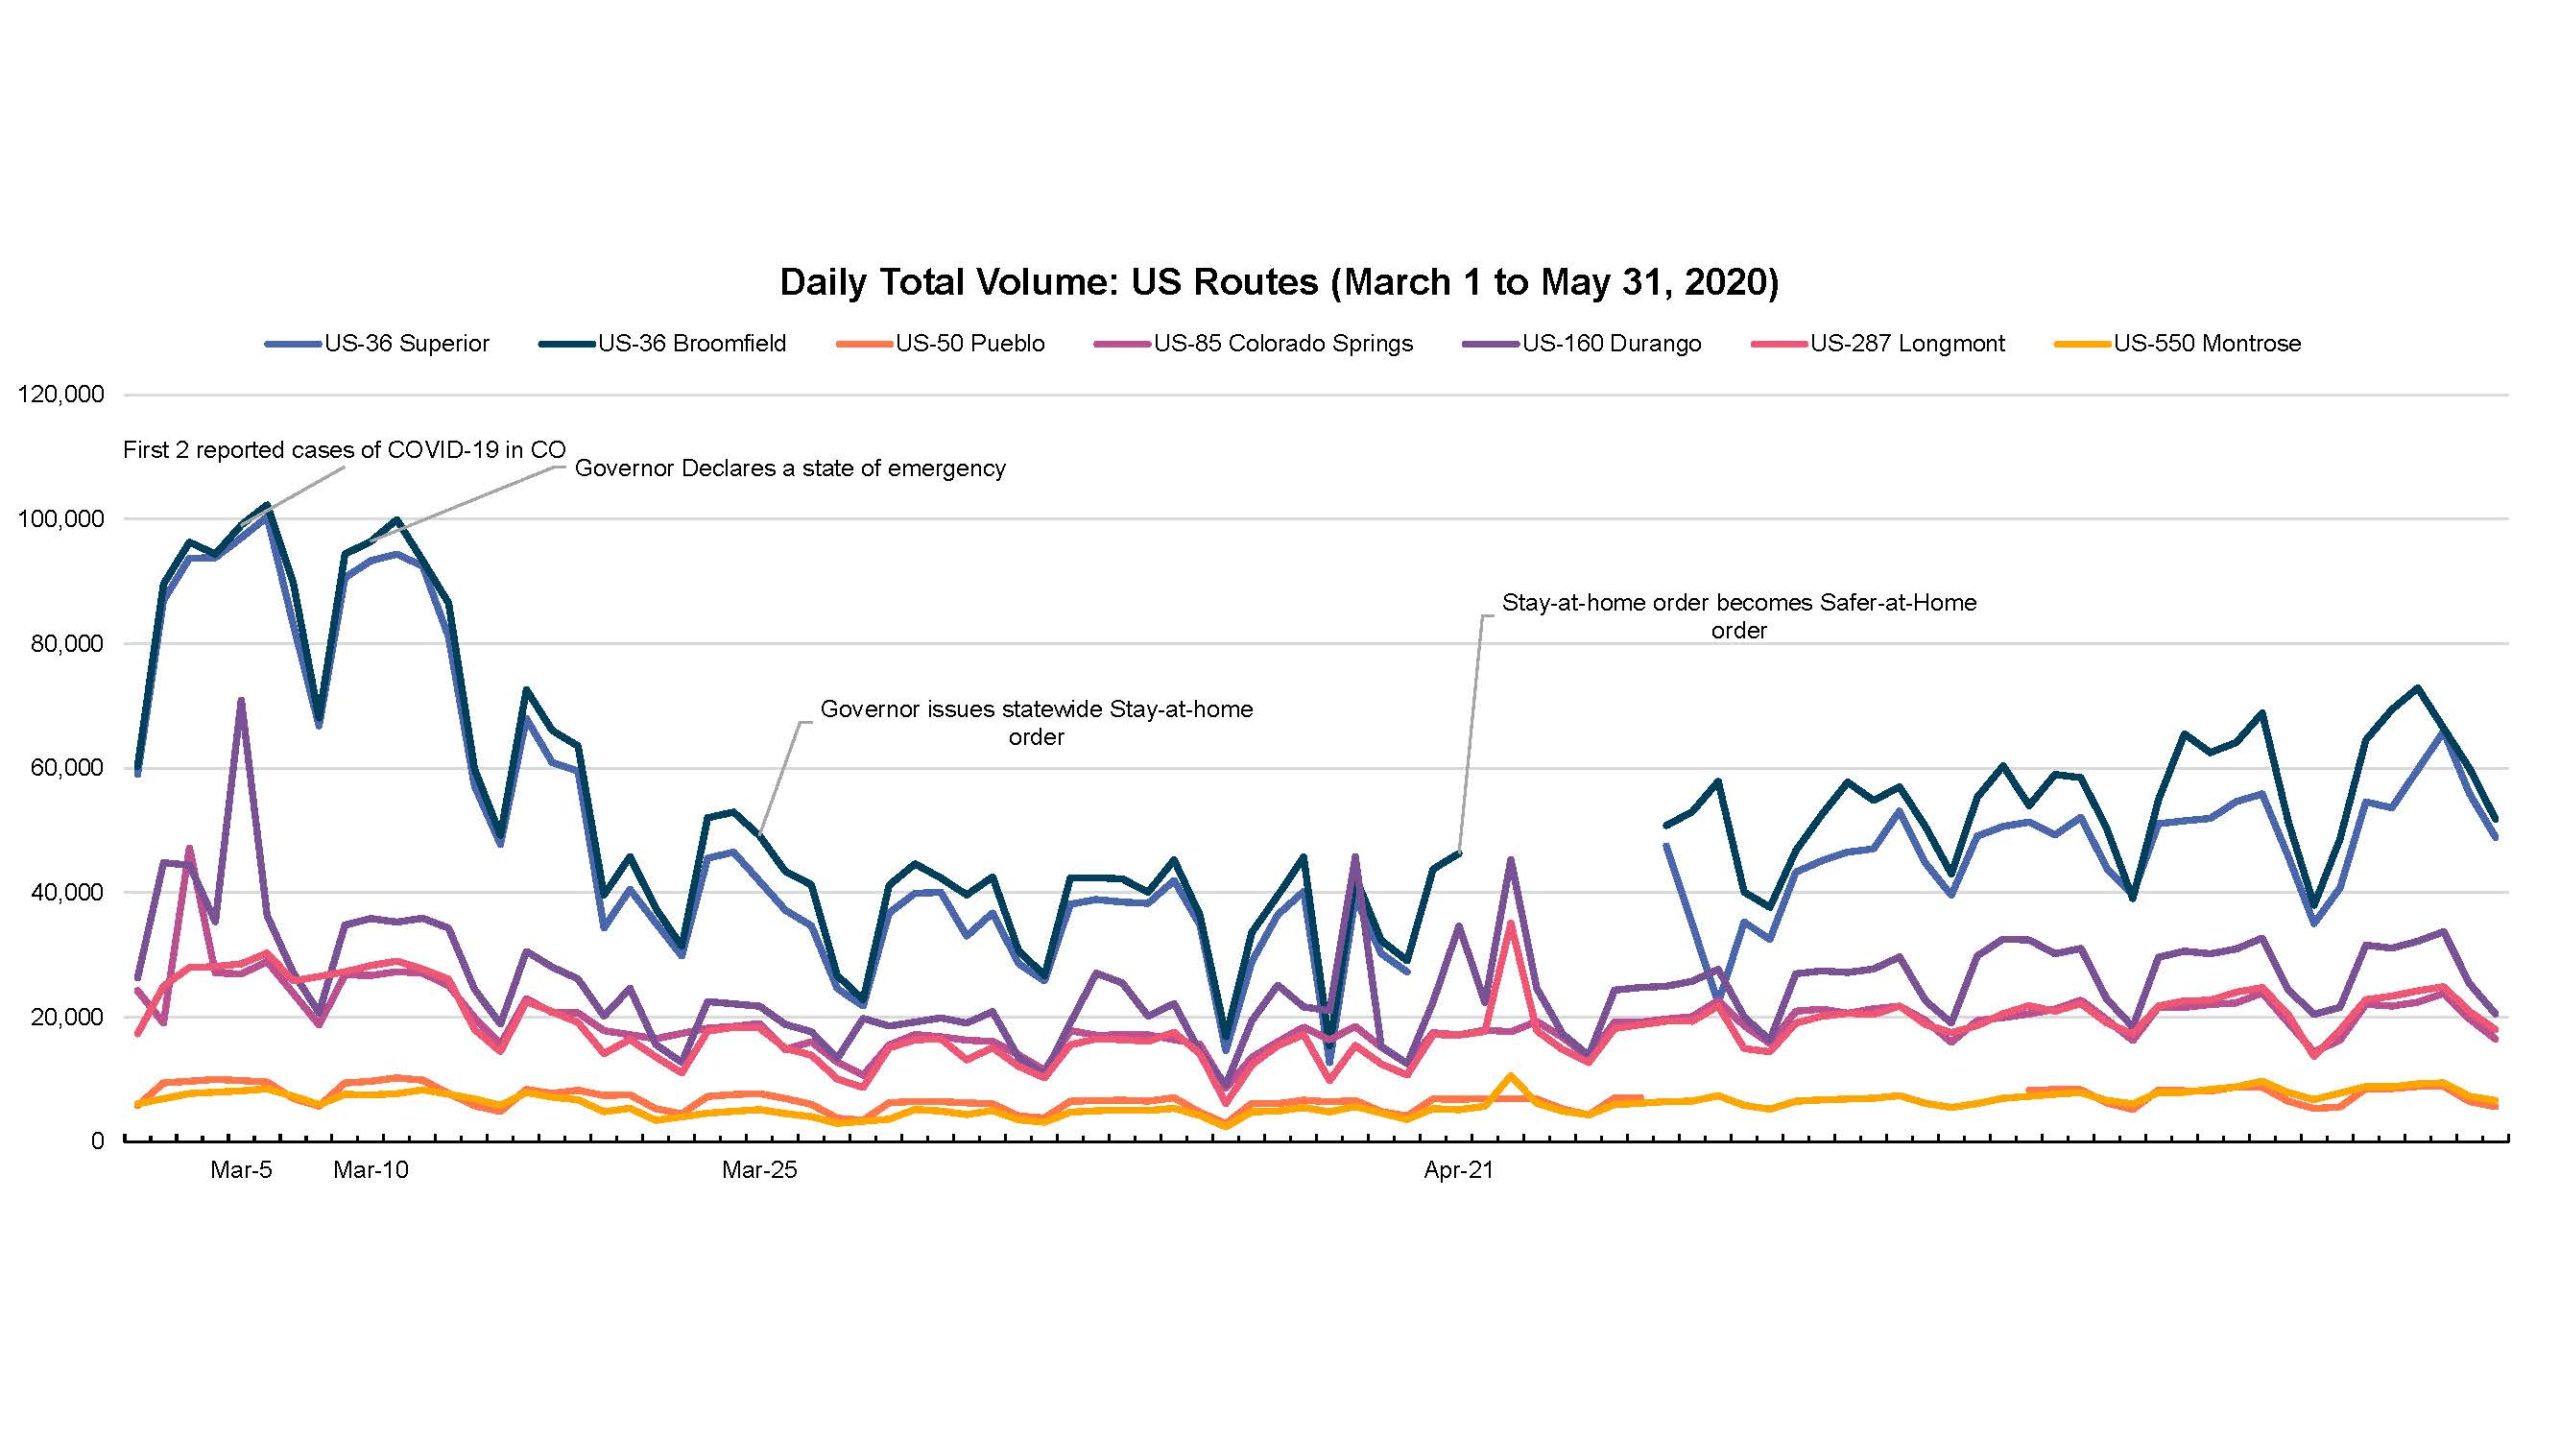
Metrics that we feel provided value included a daily volume chart that identified key decisions as a part of a timeline, and comparisons between this year and last year's traffic volumes by day. Some locations included in the report:
- Denver
- Broomfield
- Commerce City
- Keenesburg
- Durango
- Longmont
- Superior
- Pueblo
- Montrose
- Colorado Springs
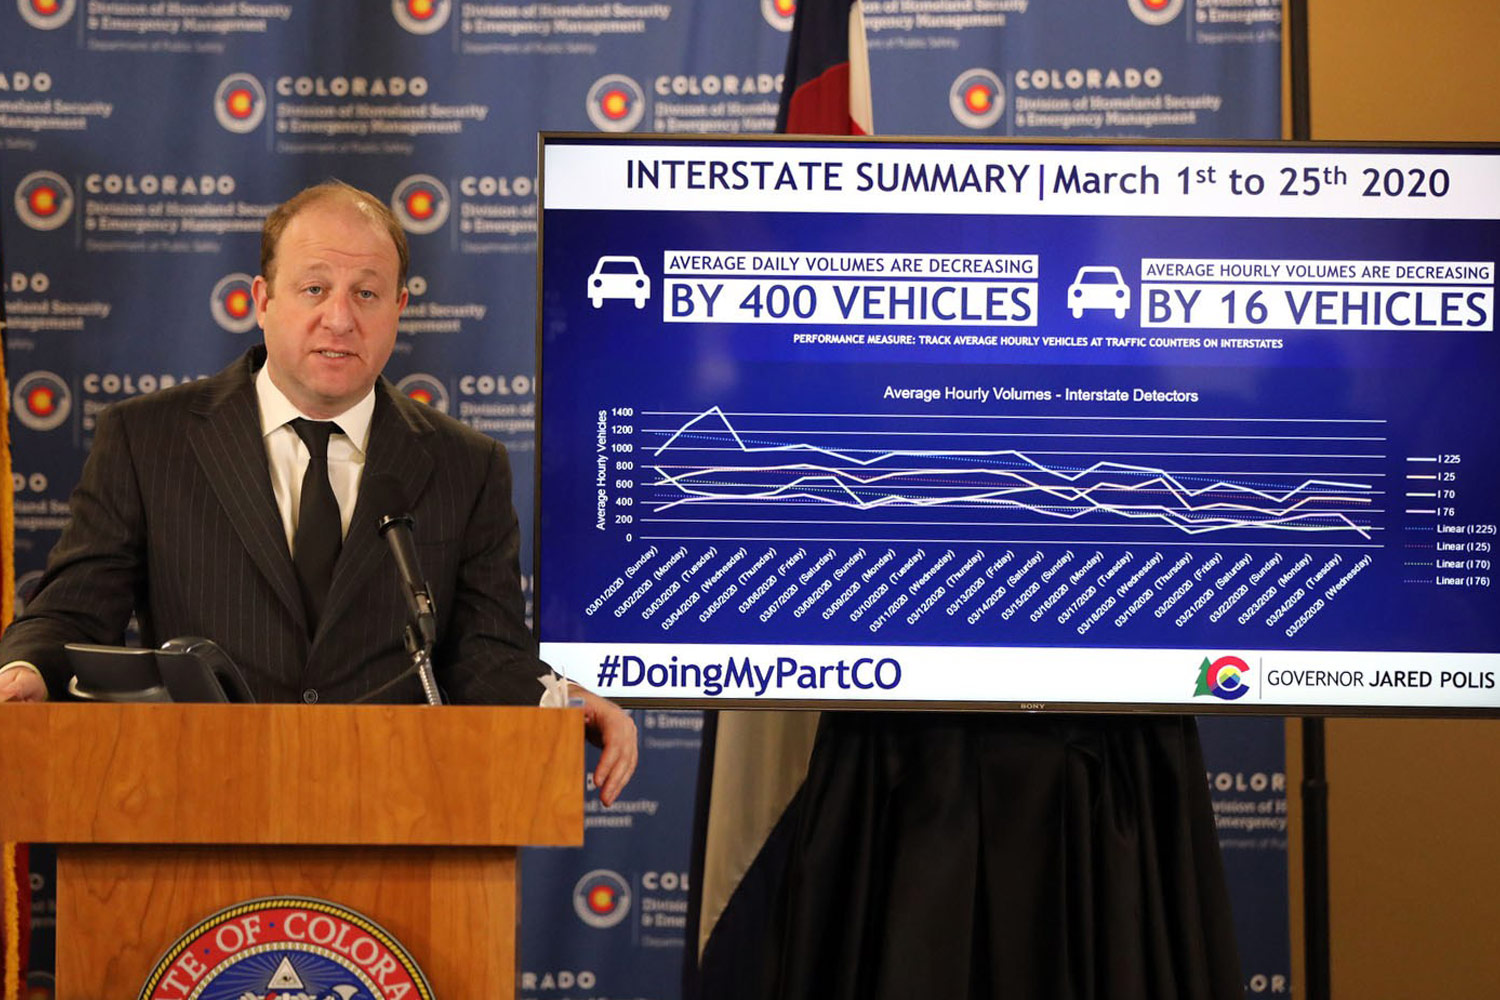
Governor Polis Reporting Delivered Data

Project Evolution
The project stakeholders met with CDOT ITS to identify ways that the reporting process could be streamlined. One opportunity identified, was that Automated Traffic Recorders (ATRs) were reporting data to two different places. Thanks to the hard work of CDOT ITS, they were able to consolidate traffic volume data across years to one consistent source, which substantially reduced time necessary to develop the report.
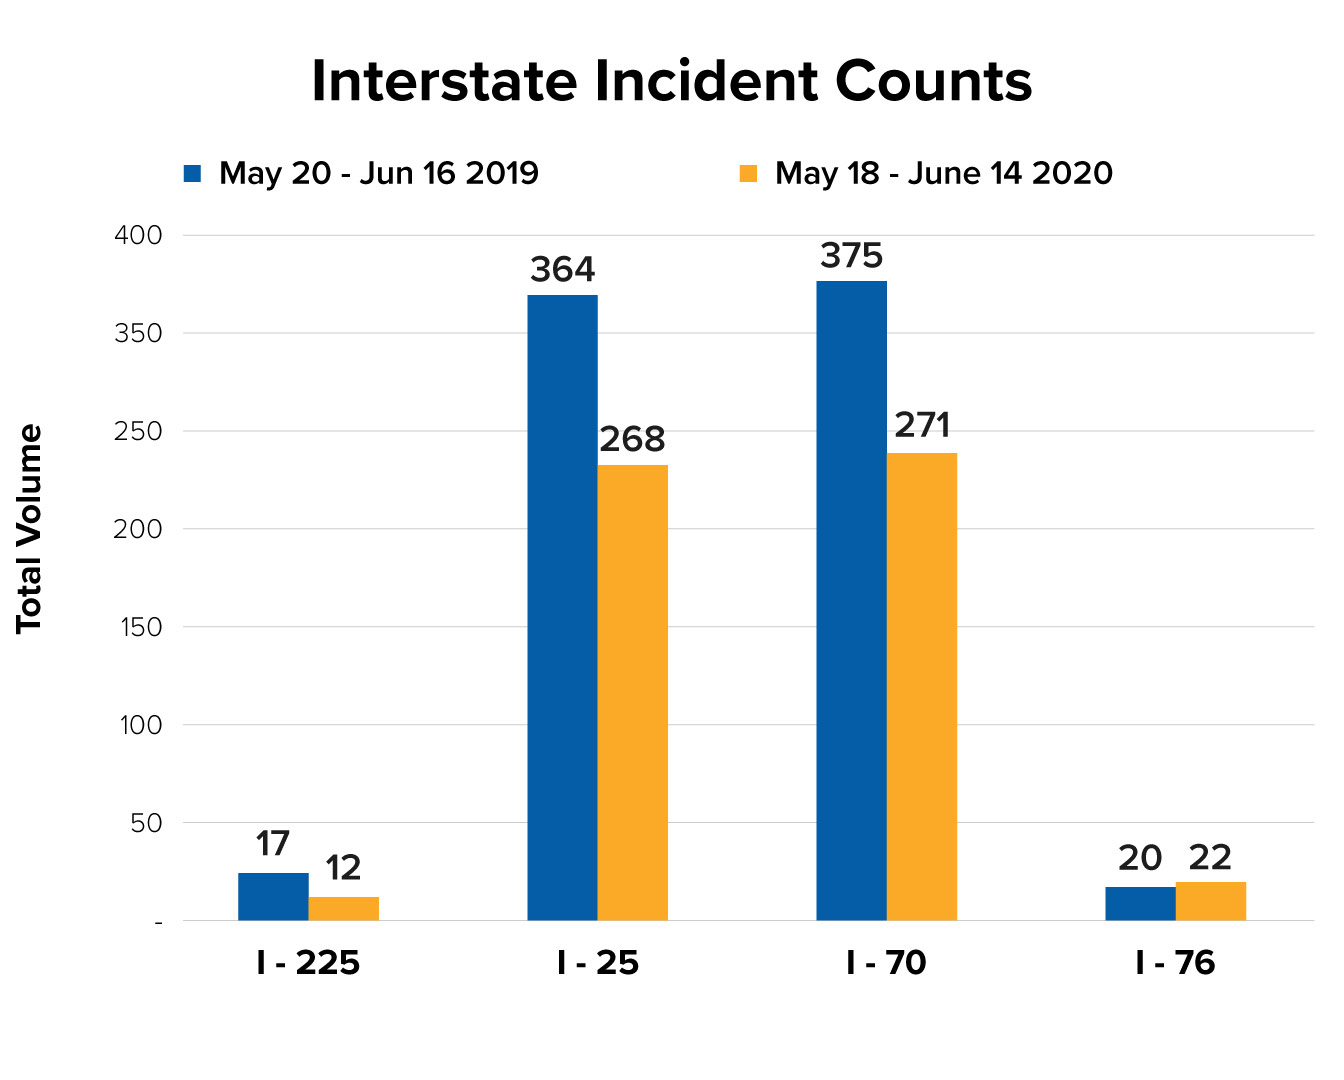
Additionally, with feedback from various CDOT divisions, a safety metric was added to the report. As traffic patterns stabilized, the reporting period was consolidated to once weekly. The current report summarizes the changes of each week and gives summary metrics on a rolling 4-week period. This allows CDOT Traffic Engineers and decision makers to more effectively monitor the traffic volume changes.
Data Set Examples
