
By Stew LaPan, Lead Data Analyst
At Navjoy, Data Analysts wear many hats. When it comes to meeting client needs, we’re fortunate to contribute to every step of the process, but at the end of the day, everything we do boils down to problem solving. We look for problems, and solutions, in data. Data may be plentiful, but they’re almost never useful right out of the box.
 Cleaning
 Cleaning
Often, we start with the client’s problem or concern and identify possible sources of data to analyze that could give us further insight on it. From there, we clean. The cleaning process maximizes the data’s utility. My cleaning process sometimes involves sorting tables of data multiple different ways to find patterns, or sometimes it means taking spreadsheets that aren’t in a useful format, parsing the text from the individual cells, and associating them with a different table.
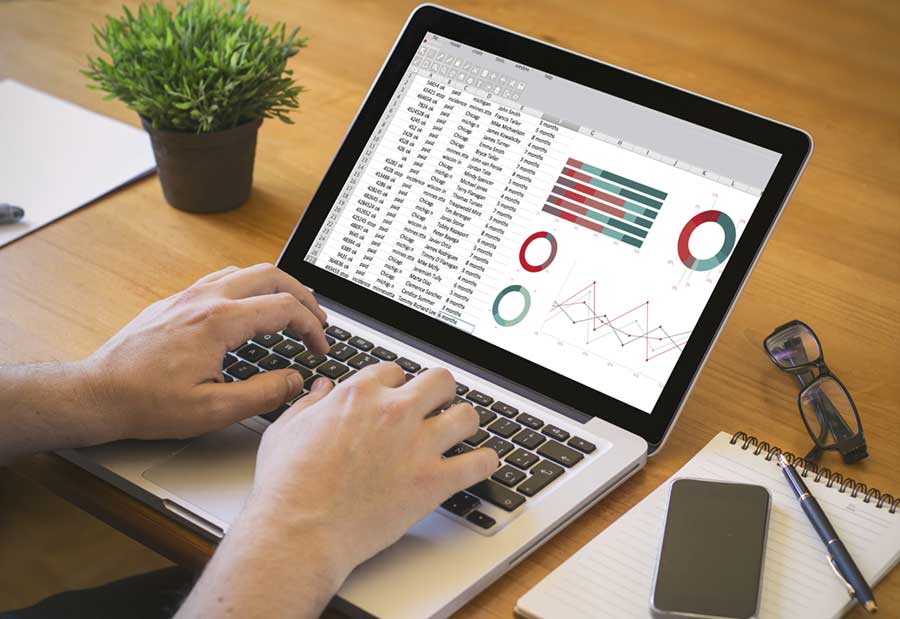
We clean data to minimize outliers, machine errors, and human error, but also to find missing values. When data is missing, I can use information in other columns to fill the gaps or I can calculate an average for the value rather than removing a point entirely. On the other hand, finding outliers is more qualitative and usually requires visually plotting data points in a scatter plot. From there, I look for points that lie outside of visual patterns or “clusters.” This cleaning process is essential for an accurate depiction of information.
Reporting
With cleaned data sets, patterns become clearer. From there, we make our data easy to digest through written reports and data visualizations. However, when we generate these reports and results, we have to adjust according to our audience. Sometimes our reports are for other government agencies and sometimes for citizens. This means we have to be able to write in different voices and at varying technical levels to meet our audience where they’re at.
Day-to-day
Full projects can last anywhere from hours to months. I’m currently working on a big project of more than a year, with smaller, quicker projects mixed in. Lately, I’ve spent a lot of time writing scripts that automate my data cleaning process. This automated cleaning helps when the data set is massive and spread across as many as 50 or more spreadsheets or when the project requires the same process be done on a regular basis. The automation significantly improves my efficiency.
 Focus
Focus
 Focus
FocusWith all this computer work, it’s important to have the right materials. I always try to work on multiple monitors and adjust the display to remove the blue light as much as possible. It reduces eye strain, even though you do lose some of the color. In my position, I do a lot of clicking and repetitive mouse movements so I use a roller ball mouse for comfort. I also listen to a handful of “data dive” playlists on Spotify that help me stay focused. Despite all the screen time, our group of data analysts is also very collaborative. We’re constantly bouncing ideas off each other within the department, and occasionally we’ll coordinate with the contractors that produce the data sets we work with as well. This communication ensures we are constantly improving our skills and strategies so we can give the client the best possible results.
All-in-all, we work hard, and we love what we do. We enjoy the puzzle solving and clearing away the noise to expose the bigger picture and patterns within. The complexities are all part of the fun.
If you have any questions about this article or about our data analytics services, contact Stew LaPan at SLaPan@navjoyinc.com